Dashboards

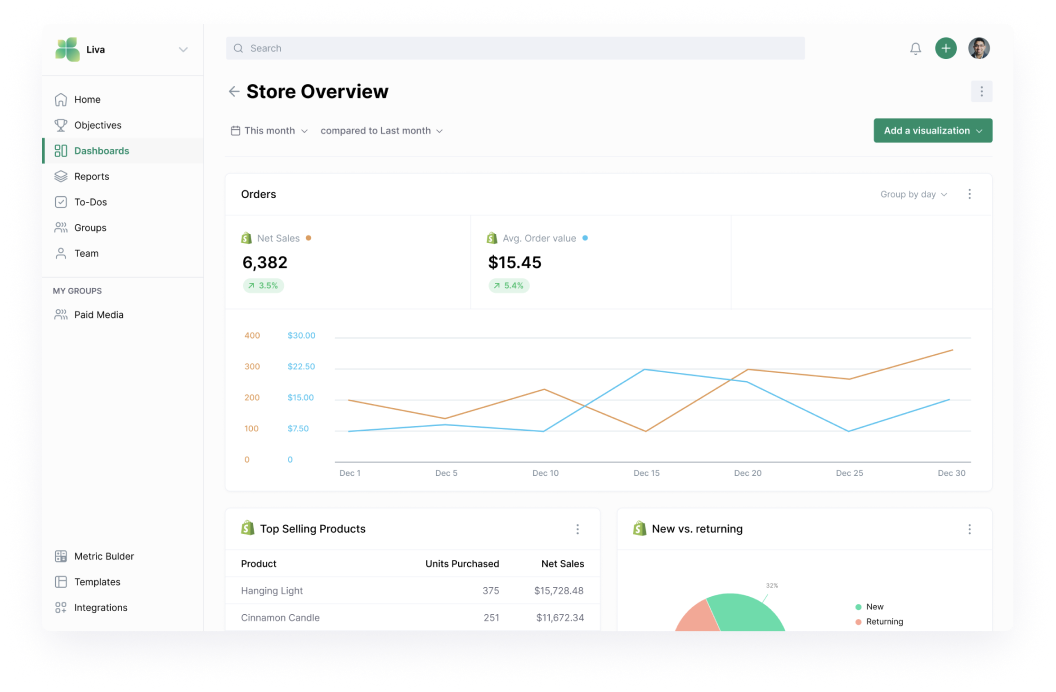
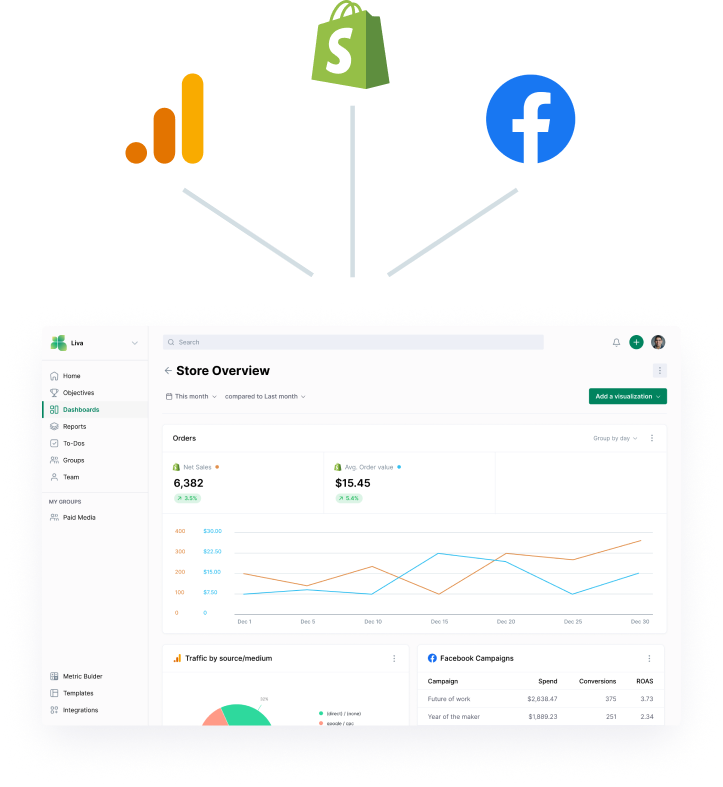
Yaguara’s Dashboards provide a real-time visualization using all the data you collect, to empower you to discover trends, gain value, and make informed decisions.

Single source of visual truth

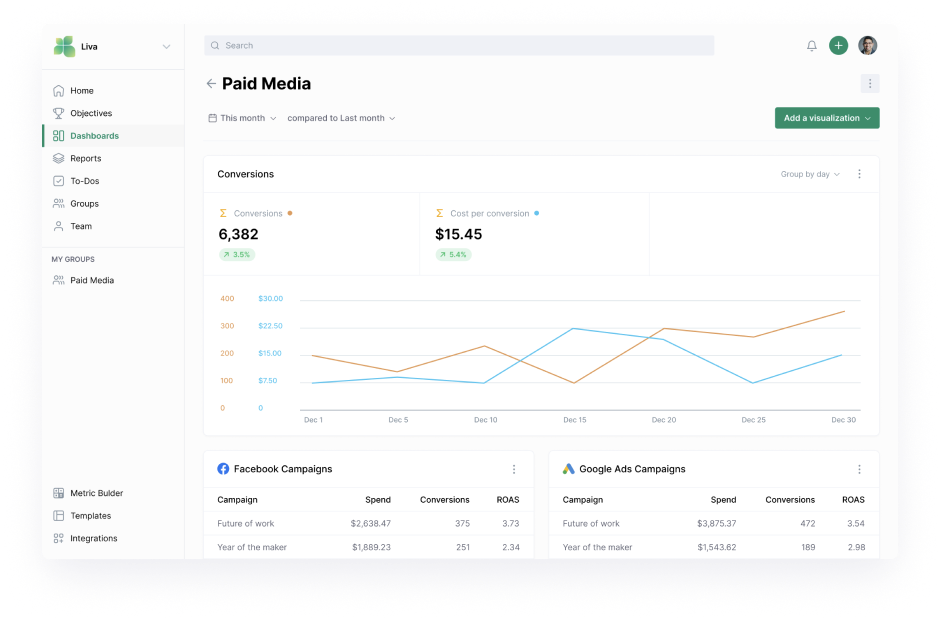
Dashboards allow you to visualize the metrics from all of your tools. And once you are prepared, you can share Dashboards with the whole company or specific teams for collaborationa in a matter of seconds.

Better decision-making

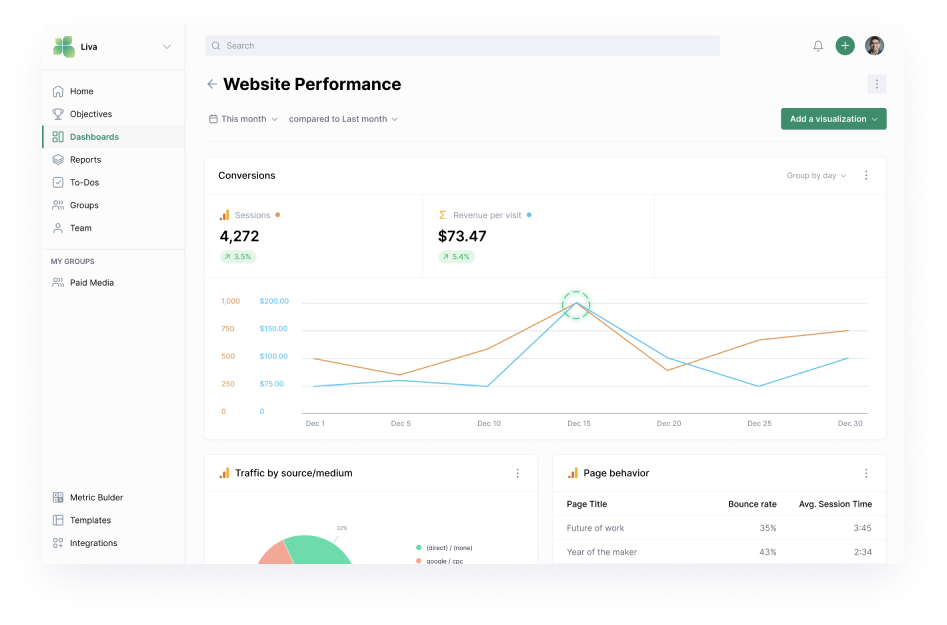
Dashboards are another opportunity to quickly detect anomalies and quickly dive into the issue. They allow for the discovery of trends by comparing multiple data sources in a single chart, even different units.

Ease of use

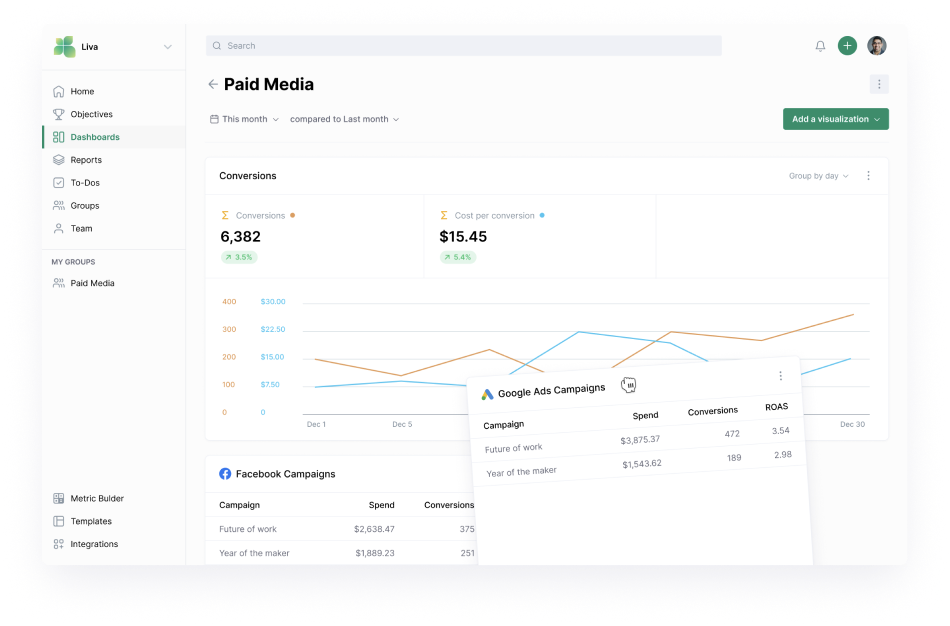
If you are spending the majority of your time in the help docs or manuals, rather than working with your data, you are moving laterally instead of forward. Dashboards can be quickly resized and reordered into your custom layout, no code involved.

Saving precious time

Dashboards save you time by not having to dig into each one of your tools to get the data you need to report on. Context switching can eliminate that amazing train of thought you have on a data trend, let’s keep you in that same place.

Orla Weir
Global Direct-To-Consumer & Brand Manager @ Ugly Drinks

“We've managed to find a home for all of our data analytics - even those outside of commerce. Having the ability to create custom metrics means we can personalise our analytics to fit our business, keeping our team aligned and up to speed on what's going on as well as allowing us to make clear and effective decisions.”

Bubba Albrecht
Founder @ Give'r

“Yaguara has helped us to be organized and focused, and created a cadence for accountability that doesn't allow for excuses or dancing around facts. We have committed to honesty, radical transparency and accountability, and this platform was the engine and rocket fuel for our liftoff.”

Get started with Dashboards

Request a demo