With more than 500 million monthly visitors, Etsy is one of the leading ecommerce marketplaces worldwide.
The marketplace is popular due to the handmade and vintage products sold on the platform. Further, most buyers land on the platform searching for unique products.
Let’s explore the details about Etsy users, demographics, revenue, and profit, as well as the details about the number of sellers and buyers in this post.
Etsy Statistics: Top Picks (2024)
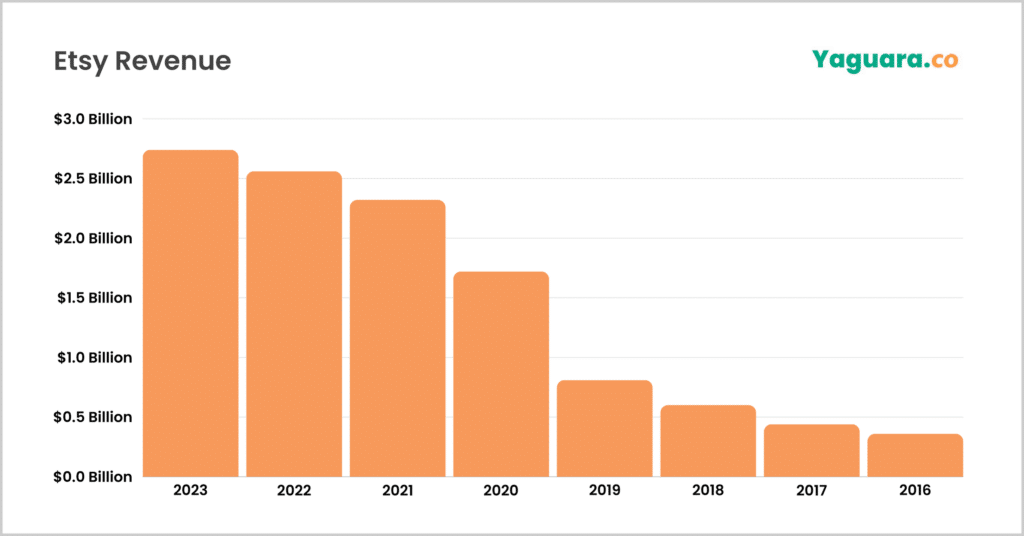
- Etsy generated a revenue of $2.748 billion in 2023.
- Around 500 million people visit Etsy every month.
- Nearly 3 in 10 Etsy users are from the age group of 25 to 34 years.
- Etsy had 97.3 million active buyers worldwide in 2023.
- Repeat buyers make 81% of purchases on Etsy.
- Etsy had 7.47 million sellers in 2022.
Etsy Revenue Statistics
Etsy generated a revenue of $2.748 billion in 2023.
That was a 7.1% YoY increase.
Comparatively, in 2022, Etsy’s revenue was $2.56 billion. This was a 10.18% increase from the previous year.
Etsy’s revenue is generated through various sources, including transaction fees, listing fees, and advertising services.
The following table displays the revenue generated by Etsy over the years and the YoY growth rate of revenue.

| Year | Etsy’s Revenue | Revenue Growth Rate |
| 2023 | $2.74 billion | 7.1% |
| 2022 | $2.56 billion | 10.18% |
| 2021 | $2.32 billion | 34.97% |
| 2020 | $1.72 billion | 111% |
| 2019 | $0.81 billion | 35.43% |
| 2018 | $0.60 billion | 36.97% |
| 2017 | $0.44 billion | 20.83% |
| 2016 | $0.36 billion | 33.70% |
| 2015 | $0.27 billion | 39.29% |
| 2014 | $0.19 billion | 56.90% |
| 2013 | $0.12 billion | 66.67% |
| 2012 | $0.07 billion | – |
Source: Macrotrends.
In 2022, Etsy’s Marketplace generated a revenue of $1.91 billion.
The marketplace revenue of Etsy accounted for approximately 75% of the company’s overall revenue in 2022.
Meanwhile, Etsy’s services generated $655.22 million in revenue.
The following table displays the revenue generated by Etsy’s marketplace and services over the years.
| Year | Marketplace Revenue | Services Revenue |
| 2022 | $1,910.89 million | $655.22 million |
| 2021 | $1,745.82 million | $583.29 million |
| 2020 | $1,303.13 million | $422.5 million |
| 2019 | $593.65 million | $224.73 million |
| 2018 | $444.77 million | $158.93 million |
| 2017 | $329.36 million | $111.87 million |
| 2016 | $269.63 million | $89.43 million |
| 2015 | $204.33 million | $64.92 million |
Source: Statista.
Etsy Profit Statistics
Etsy did not have a profitable year in 2022, as it faced a loss of $694.29 million.
That’s a significant decrease from the profit of $493.51 million recorded in 2021.
The following table displays the profit or the net income generated by Etsy over the years.
| Year | Annual Net Income |
| 2022 | -$694.29 million |
| 2021 | $493.51 million |
| 2020 | $349.25 million |
| 2019 | $95.89 million |
| 2018 | $77.49 million |
| 2017 | $81.8 million |
| 2016 | $-29.9 million |
| 2015 | $-54.06 million |
| 2014 | $-15.24 million |
| 2013 | $-0.8 million |
| 2012 | $-2.39 million |
Source: Statista.
Etsy Traffic Statistics
Nearly 500 million people visit Etsy every month.
In February 2024, 412.6 million people visited the platform.
Comparatively, 536.1 million and 499.8 million people visited Etsy in December 2023 and November 2023, respectively.
The following table displays the traffic received by Etsy in the past three months.
| Month/ Year | Number of Visits Received on Etsy |
| February 2024 | 412.6 million |
| January 2024 | 474.1 million |
| December 2023 | 536.1 million |
| November 2023 | 499.8 million |
| October 2023 | 479.5 million |
| September 2023 | 454.2 million |
Source: Similar Web.
Etsy received the highest traffic share from the United States, at 55.70% as of January 2024.
However, the share of traffic sent by the United States to Etsy in January 2024 was reduced by 15.30% compared to December 2023.
The United Kingdom has the second-highest share of Etsy users.
The following table displays the countries that have the highest traffic share of Etsy.
| Country | Etsy Traffic share |
| United States | 55.70% |
| United Kingdom | 9.48% |
| Germany | 5.44% |
| Canada | 5.32% |
| Australia | 3.05% |
| Others | 21.01% |
Source: Similar Web.
Etsy User Demographics
58.35% of Etsy users are female, while 41.65% are male.
Nearly 6 in 10 Etsy users are female, and over 4 in 10 users are male.
This displays that more women prefer to shop for fashion, jewelry, household goods, and more on Etsy.
Source: Similar Web.
Nearly 3 in 10 Etsy users are from the age group of 25 to 34 years.
According to the latest data, 29.62% of Etsy users are 25 to 34 years old.
Meanwhile, nearly 4 in 5 users belong to the age group of 35 to 44 years.
The following table displays the age demographics of Etsy users worldwide.
| Age Group | Percentage of Etsy users |
| 18 to 24 years | 17.53% |
| 25 to 34 years | 29.62% |
| 35 to 44 years | 18.22% |
| 45 to 54 years | 15.00% |
| 55 to 64 years | 11.76% |
| 65 plus | 7.87% |
Source: Similar Web.
Etsy Buyer Statistics
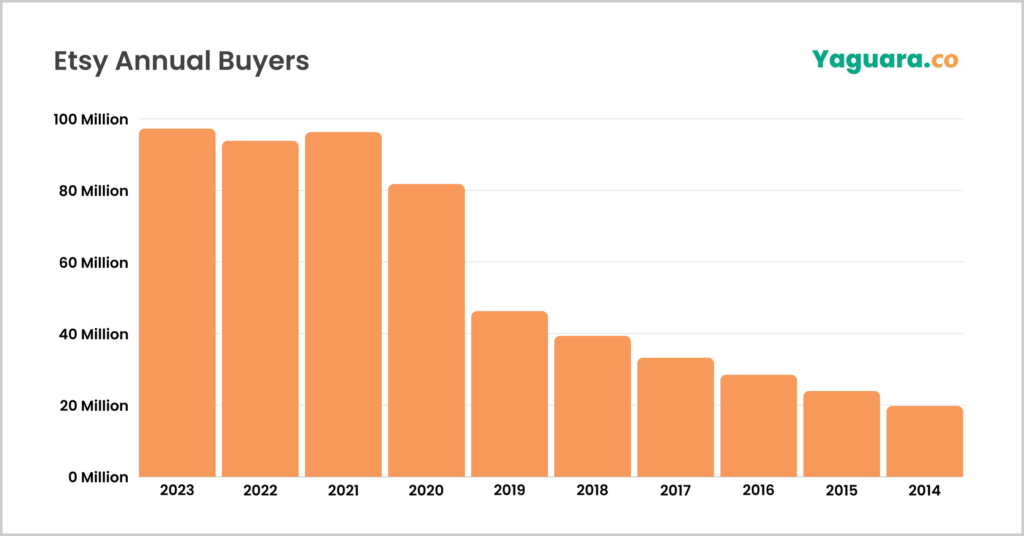
Etsy had 97.3 million active buyers worldwide in 2023.
Active buyers of Etsy increased by 3.4% in 2023.
Of these, 6 million are reactivated buyers. This number is up by 19% compared to the previous year. Plus, the platform has gained 6 million new buyers.
The following table displays the number of Etsy Annual buyers recorded over the years.

| Year | Number of Etsy Buyers |
| 2023 | 97.3 million |
| 2022 | 93.9 million |
| 2021 | 96.3 million |
| 2020 | 81.8 million |
| 2019 | 46.3 million |
| 2018 | 39.4 million |
| 2017 | 33.3 million |
| 2016 | 28.5 million |
| 2015 | 24 million |
| 2014 | 19.8 million |
Source: Analyzify, Business Of Apps.
Etsy Seller Statistics
Etsy had 7.47 million sellers in 2022.
This number has decreased slightly from 7.52 million sellers recorded in 2021.
Etsy sellers grew rapidly from 2,699,000 in 2019 to 7,522,000 in 2021. This was an increase of 4,823,000 sellers in just 2 years.
The following table displays the number of sellers on Etsy recorded over the years.
| Year | Number of Etsy Sellers |
| 2022 | 7,470,000 |
| 2021 | 7,522,000 |
| 2020 | 4,365,000 |
| 2019 | 2,699,000 |
| 2018 | 2,115,000 |
| 2017 | 1,933,000 |
| 2016 | 1,748,000 |
| 2015 | 1,563,000 |
| 2014 | 1,353,000 |
| 2013 | 1,074,000 |
Source: Statista.
Etsy Advertising Expenditure
In the year 2022, Etsy invested $581.1 million in advertising and marketing.
That was a 4% increase in the investment compared to the previous year. In 2021, Etsy spent $559.3 million on advertising and marketing of the platform.
Etsy increased its advertising expenditure from $175.2 million in 2019 to $442.2 million in 2020. This was an increase of 152.4% in the investment.
The following table displays the investments made by Etsy in the advertising and Marketing sector.
| Year | Spent On Global Advertising |
| 2022 | $581.1 million |
| 2021 | $559.3 million |
| 2020 | $442.2 million |
| 2019 | $175.2 million |
| 2018 | $129.1 million |
| 2017 | $78.4 million |
| 2016 | $55.2 million |
Source: Statista.
Etsy Usage Statistics
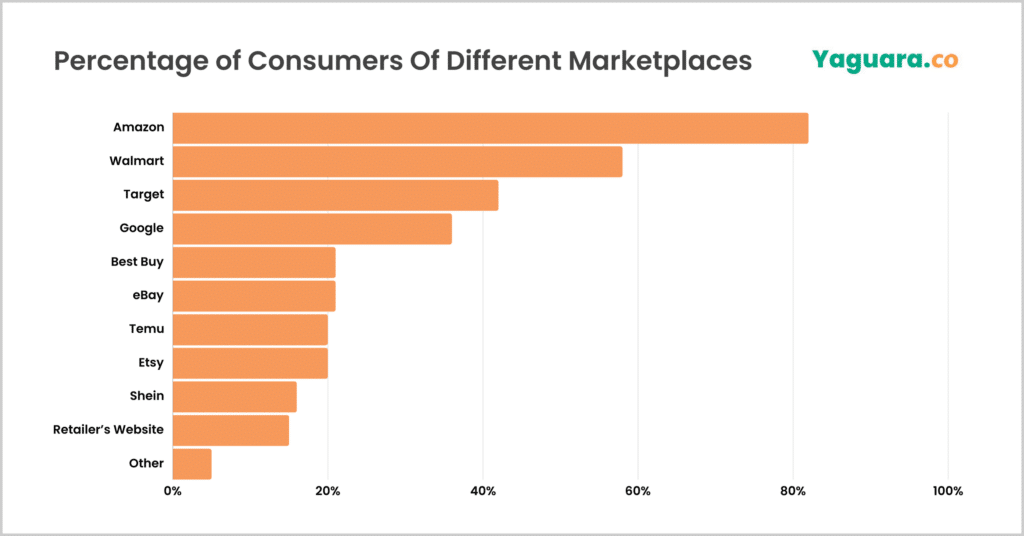
Nearly 2 in 10 consumers in the United States said that they planned to shop from Etsy for holiday gifts in 2023.
Etsy was the eighth choice of online shoppers in the US for purchasing holiday gifts in 2023.
Meanwhile, Amazon was the top choice as 82% of the consumers looked forward to shopping from Amazon.
The following table displays the leading websites that wished to purchase holiday gifts from Etsy in 2023.

| Online Market Place | Percentage of Consumers |
| Amazon | 82% |
| Walmart | 58% |
| Target | 42% |
| 36% | |
| Best Buy | 21% |
| eBay | 21% |
| Temu | 20% |
| Etsy | 20% |
| Shein | 16% |
| Another brand or retailer’s website | 15% |
| Other | 5% |
Source: Statista.
The statistics suggest that Etsy is one of the thriving marketplaces that connects nearly 7.5 million sellers with over 97.3 million buyers.
Etsys’ continued revenue growth and profitability display that the market has the ability to expand further in the upcoming years with the increased adoption of ecommerce worldwide.
Here are some related reads you can check out:
